P&K 3950
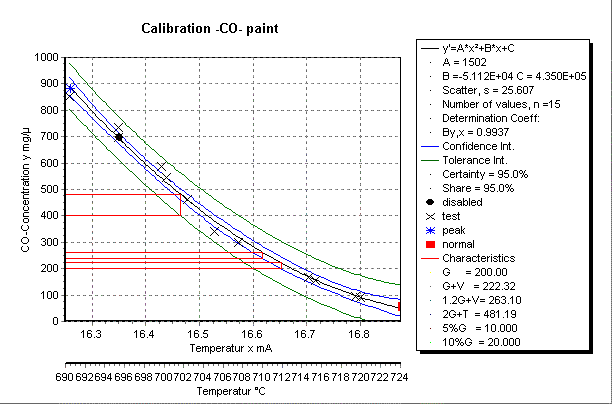
Sample: Calibration -CO- paint
Product has been archived / Produkt wurde archiviert

Input data
| Temperatur | CO-Concentration | Status | B |
|---|
| mA | mg/µ | [] | [] |
|---|
| 16.879 | 56.3 | normal | Normal operation |
| 16.879 | 56.4 | test | |
| 16.800 | 92.6 | test | |
| 16.791 | 95.2 | test | |
| 16.716 | 153.8 | test | |
| 16.704 | 165.1 | test | |
| 16.572 | 299.7 | test | |
| 16.528 | 339.4 | test | |
| 16.477 | 461.1 | test | |
| 16.438 | 543.6 | test | |
| 16.430 | 585.3 | test | |
| 16.349 | 735.5 | test | |
| 16.348 | 698.3 | test | |
| 16.350 | 696.2 | disabled | |
| 16.258 | 850.6 | test | |
| 16.260 | 881.3 | peak | |
Characteristics
Function: y'=A*x²+B*x+C
| Coefficients | | | 1502 | | -5.112E+04 | | 4.350E+05 |
|
| Scatter | s | 25.61 |
| Determination coefficient | | 0.9937 |
| Average value | | |
| Calculated values | | |
List of function values
| x | y' | Confidence interval | Tolerance interval | n' |
|---|
| | | y1 | y2 | y3 | y4 | |
|---|
| 15.000 | 6142.2 | 5136.5 | 7148.0 | | | 0.0031 |
| 15.182 | 5089.4 | 4305.3 | 5873.5 | | | 0.0051 |
| 15.364 | 4135.8 | 3546.1 | 4725.4 | | | 0.0090 |
| 15.545 | 3281.5 | 2859.1 | 3703.9 | | | 0.0175 |
| 15.727 | 2526.4 | 2244.0 | 2808.9 | | | 0.0391 |
| 15.909 | 1870.6 | 1700.8 | 2040.5 | | | 0.1080 |
| 16.091 | 1314.1 | 1229.0 | 1399.2 | | | 0.4301 |
| 16.273 | 856.87 | 825.99 | 887.75 | 770.51 | 943.23 | 3.2685 |
| 16.454 | 498.89 | 478.41 | 519.37 | 417.93 | 579.85 | 7.4309 |
| 16.636 | 240.18 | 217.45 | 262.90 | 158.17 | 322.18 | 6.0345 |
| 16.818 | 80.728 | 57.278 | 104.18 | -1.632 | 163.09 | 5.6669 |
| 17.000 | 20.546 | -44.70 | 85.798 | | | 0.7319 |
Confidence interval:
Valid for 95.0 percentage statistical certainty with table value t(12)= 2.1800
Tolerance interval:
Valid for 95.0 percentage statistical certainty with table value v(12)= 1.5161 and a share (1-gamma)=95.0 % of the entire collective
Function comparison (significance test)
Coefficients and scatter of the function:
| Statement | Function | s | A | B | C |
|---|
| 1 | y'=B*x+C | 61.67 | | -1338 | 2.255E+04 |
| 2 | y'=A*x²+B*x+C | 25.61 | 1502 | -5.112E+04 | 4.350E+05 |
| 3 | y'=B*ln(x)+C | 60.28 | | -2.219E+04 | 6.268E+04 |
| 4 | y'=A*ln²(x)+B*ln(x)+C | 25.92 | 3.995E+05 | -2.265E+06 | 3.212E+06 |
| 5 | y'=B*exp(x)+C | 84.95 | | -8.195E-05 | 1707 |
| 6 | y'=A*exp²(x)+B*exp(x)+C | 23.01 | 8.735E-12 | -3.693E-04 | 3968 |
The quadratic regression formula can be assumed as better than the linear one.
| Test value: | 63.388 |
| Table value F(12): | 4.7522 |
| Statistical certainty: | 95% |
Only statement 1 and 2 are compared.
Characteristics / limits
| Name | Factor | Type | Y-value | Y(Type) | delta Y | X |
|---|
| G | 1 | -- | 200 | | | 16.672 |
| G+V | 1 | +V | 200 | 222.32 | 22.321 | 16.652 |
| 1.2G+V | 1.2 | +V | 240 | 263.10 | 23.102 | 16.616 |
| 2G+T | 2 | +T | 400 | 481.19 | 81.189 | 16.464 |
| 5%G | 0.05 | -- | 10 | | | |
| 10%G | 0.1 | -- | 20 | | | |


