P&K TAL2K (TA Luft 2002 / AUSTAL)
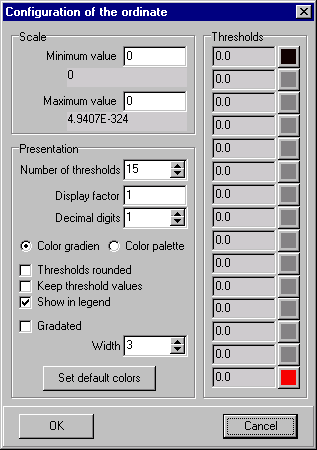
Configuration of the ordinate
New Version P&K AST

Minimum value, Maximum value
Minimum value of the scale. If the minimum is higher/equal than the maximum value, automatic scaling will be performed. Both values are absolute, which means the display factor is not considered. In addition, the extreme values will be shown below the entry fields. For displaying the fractions, the value of decimal digits is to be considered.
Color gradient
A color transition from a starting color to an ending color can be set here. The colors are to be defined under "Thresholds".
Color palette
For certain threshold values, individual colors can be defined under "Thresholds".
Number of thresholds
The difference between maximum and minimum of the scale will be divided into equidistant threshold values.
Thresholds rounded
This has only influence on the illustration of colored shapes.
If checked, then the thresholds represent a range. The definition of the thresholds 1,2,3 actually means then 0.5 to 1.5, 1.5 to 2.5 and greater 2.5. The ranges are not determined by rounding, but by splitting the distances. The lowest range is derived from the distance between the first and the second value.
If not checked, then the value is greater or equal the threshold with displayed color and smaller than the next higher threshold. Values smaller than the lowest threshold are not displayed. Thresholds in the graphic legend are preceded with a ">".
Keep thresholds values
The automatic calculation of threshold values can be disabled here and user defined values can be entered under "Thresholds". They must be entered in ascending order.
Display factor
The scale will be converted into a legible dimension with this factor. It will be added to the axis name. The display factor can be noted as 1e-9 instead of 0.000000001; this is equal to 10-9. Alternatively, one can turn off "automatic title modification" and change e.g. the unit.
Decimal digits
The number of the decimal places to be generated can be adjusted here. This does not change the accuracy of the calculated values, but is available for better legibility. If the number of the decimal places selected is too high or the numbers are too big, the program automatically selects the scientific representation.
Show in legend
The color palette with the threshold values will be inserted into the graphic legend.
Gradated
Isolines can be viewed on different levels in a 3D-illustration illustration.
Threshold values
The threshold values and the colors corresponding to them are shown or defined here.
Width
A line width for the illustration of the lines can be selected here.

