P&K 3950
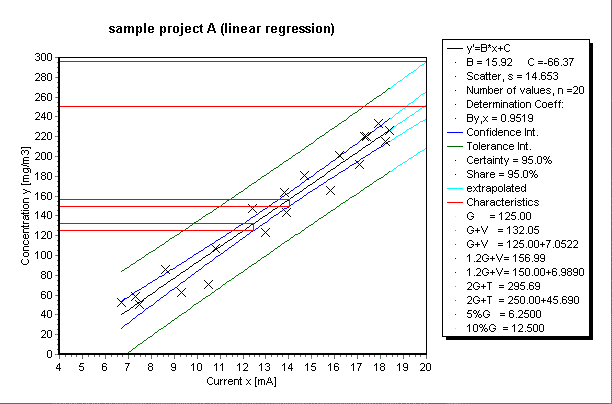
Sample: project A (linear regression)
Product has been archived / Produkt wurde archiviert

Input data
| Current | Concentration |
|---|
| [mA] | [mg/m3] |
|---|
| 6.7 | 53 |
| 7.5 | 50 |
| 7.3 | 59 |
| 8.6 | 86 |
| 9.3 | 63 |
| 10.5 | 71 |
| 10.8 | 107 |
| 13.0 | 123 |
| 12.4 | 147 |
| 13.9 | 143 |
| 13.8 | 164 |
| 14.7 | 181 |
| 15.8 | 166 |
| 16.2 | 201 |
| 17.1 | 192 |
| 17.3 | 220 |
| 17.4 | 220 |
| 17.9 | 233 |
| 18.2 | 215 |
| 18.4 | 226 |
Characteristics
Function: y'=B*x+C
| Coefficients | | |
| Scatter | s | 14.65 |
| Determination coefficient | | 0.9519 |
| Average value | | |
| Calculated values | | |
List of function values
| x | y' | Confidence interval | Tolerance interval | n' |
|---|
| | | y1 | y2 | y3 | y4 | |
|---|
| 6.7000 | 40.293 | 26.658 | 53.928 | -3.085 | 83.671 | 5.1011 |
| 7.7636 | 57.225 | 45.179 | 69.271 | 14.587 | 99.864 | 6.5360 |
| 8.8272 | 74.157 | 63.603 | 84.712 | 32.151 | 116.16 | 8.5139 |
| 9.8908 | 91.090 | 81.881 | 100.30 | 49.596 | 132.58 | 11.185 |
| 10.954 | 108.02 | 99.941 | 116.10 | 66.912 | 149.13 | 14.524 |
| 12.018 | 124.95 | 117.68 | 132.23 | 84.091 | 165.82 | 17.925 |
| 13.082 | 141.89 | 134.98 | 148.79 | 101.13 | 182.64 | 19.912 |
| 14.145 | 158.82 | 151.79 | 165.85 | 118.03 | 199.61 | 19.176 |
| 15.209 | 175.75 | 168.11 | 183.39 | 134.78 | 216.72 | 16.242 |
| 16.272 | 192.68 | 184.06 | 201.31 | 151.39 | 233.97 | 12.742 |
| 17.336 | 209.62 | 199.74 | 219.49 | 167.87 | 251.36 | 9.7191 |
| 18.400 | 226.55 | 215.24 | 237.85 | 184.23 | 268.86 | 7.4188 |
Confidence interval:
Valid for 95.0 percentage statistical certainty with table value t(18)= 2.1017
Tolerance interval:
Valid for 95.0 percentage statistical certainty with table value v(18)= 1.3847 and a share (1-gamma)=95.0 % of the entire collective
Function comparison (significance test)
Coefficients and scatter of the function:
| Statement | Function | s | A | B | C |
|---|
| 1 | y'=B*x+C | 14.65 | | 15.92 | -66.37 |
| 2 | y'=A*x²+B*x+C | 14.60 | 0.2924 | 8.470 | -23.43 |
| 3 | y'=B*ln(x)+C | 18.83 | | 187.0 | -329.2 |
| 4 | y'=A*ln²(x)+B*ln(x)+C | 14.24 | 141.5 | -504.0 | 497.9 |
| 5 | y'=B*exp(x)+C | 47.34 | | 1.559E-06 | 118.2 |
| 6 | y'=A*exp²(x)+B*exp(x)+C | 39.23 | -3.647E-14 | 4.575E-06 | 106.1 |
The quadratic regression formula cannot be assumed as better than the linear one.
| Test value: | 1.1201 |
| Table value F(17): | 4.4546 |
| Statistical certainty: | 95% |
Only statement 1 and 2 are compared.
Characteristics / limits
| Name | Factor | Type | Y-value | Y(Type) | delta Y | X |
|---|
| G | 1 | -- | 125 | | | 12.020 |
| G+V | 1 | +V | 125 | 132.05 | 7.0521 | 12.463 |
| 1.2G+V | 1.2 | +V | 150 | 156.98 | 6.9889 | 14.030 |
| 2G+T | 2 | +T | 250 | 295.69 | 45.69 | 22.742 |
| 5%G | 0.05 | -- | 6.25 | | | 4.5615 |
| 10%G | 0.1 | -- | 12.5 | | | 4.9541 |


